
How do I know my monthly recurring income and why customers stop?
| Intagya ERP

Bring your subscriptions into one report. Intagya ERP converts each active subscription to what it is worth per month, giving you monthly and yearly recurring income. Each stopped subscription records a reason, so you see the top reasons and the stop rate for any period, service, plan or duration.
At the year-end meeting a partner asked: how much do we earn per month from subscriptions? The manager gave one number and the accountant another. Neither was wrong. He had added up this month's invoices, and she had counted one big yearly invoice as a single month's income.
That is the trouble with subscriptions. Invoices move on different dates, so they do not tell you what really comes in each month.
What is monthly recurring income?
It is what each active subscription is worth per month. A yearly subscription of 12,000 is 1,000 a month, and a quarterly one of 3,000 is also 1,000. Add them up and you have a steady number to compare month to month.
It is worked out before tax, since tax is not your income. Multiply by twelve for yearly recurring income.
Where do I see how subscriptions stand today?
On the overview, the first screen of the app: active subscriptions, monthly income, what falls due in 30 days and what is late.
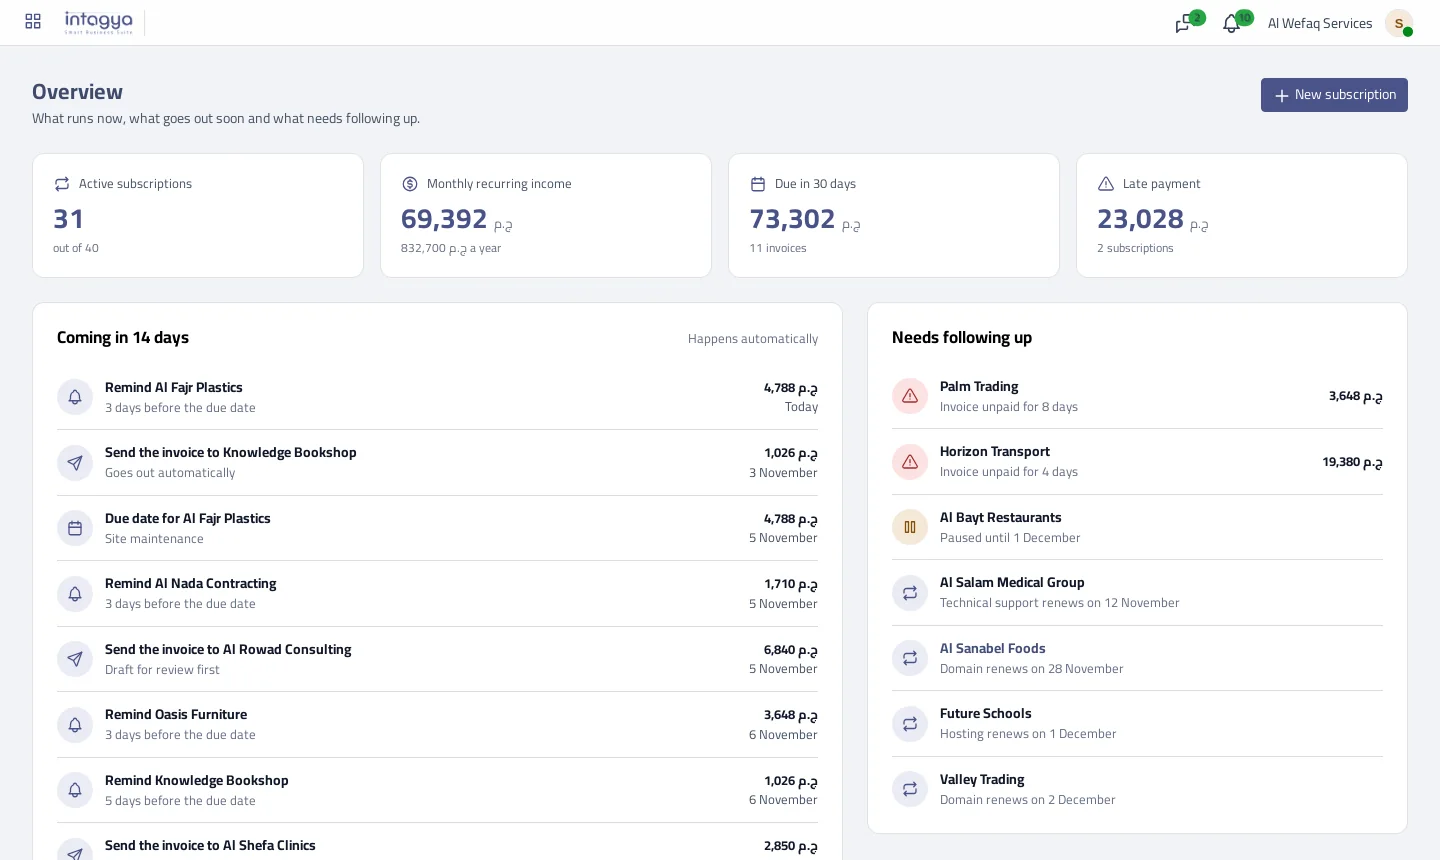
Below them are the next 14 days and what needs following up. I would open this each morning rather than ask anyone.
How do I compare services and periods?
From the reports screen. Pick the period: the last 3, 6 or 12 months, this year, or a custom range from month to month. Then pick the service, plan, duration and status.
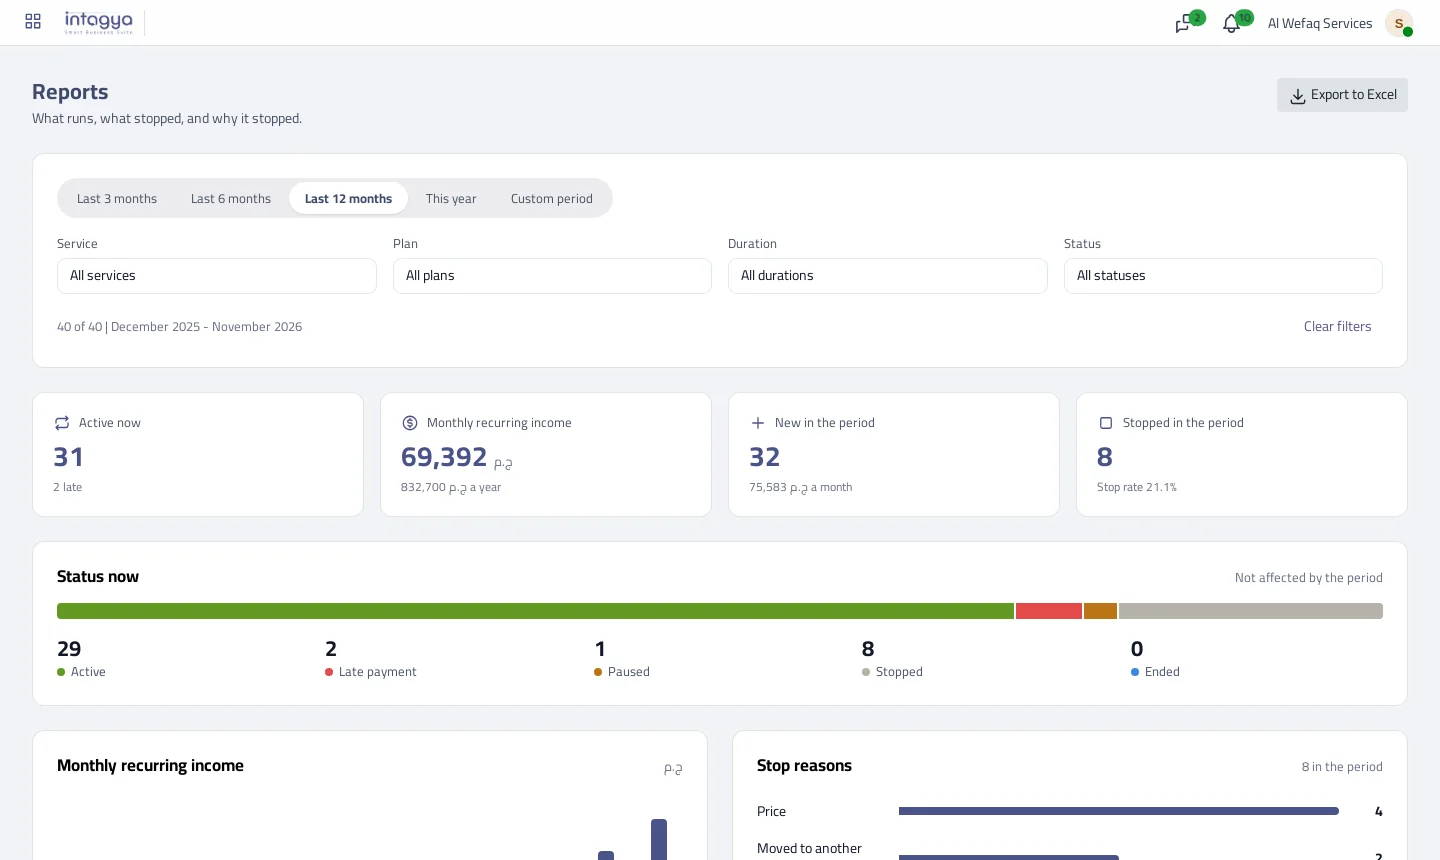
Every figure follows, except the status bar, which is a picture of today and ignores the period. Try isolating yearly subscriptions: the picture often differs from monthly.
Why do my customers stop?
Because every stop asks for a reason, scattered stories turn into a ranked list: price, moved to another supplier, no longer needed, late payment, business closed, plus your own reasons.
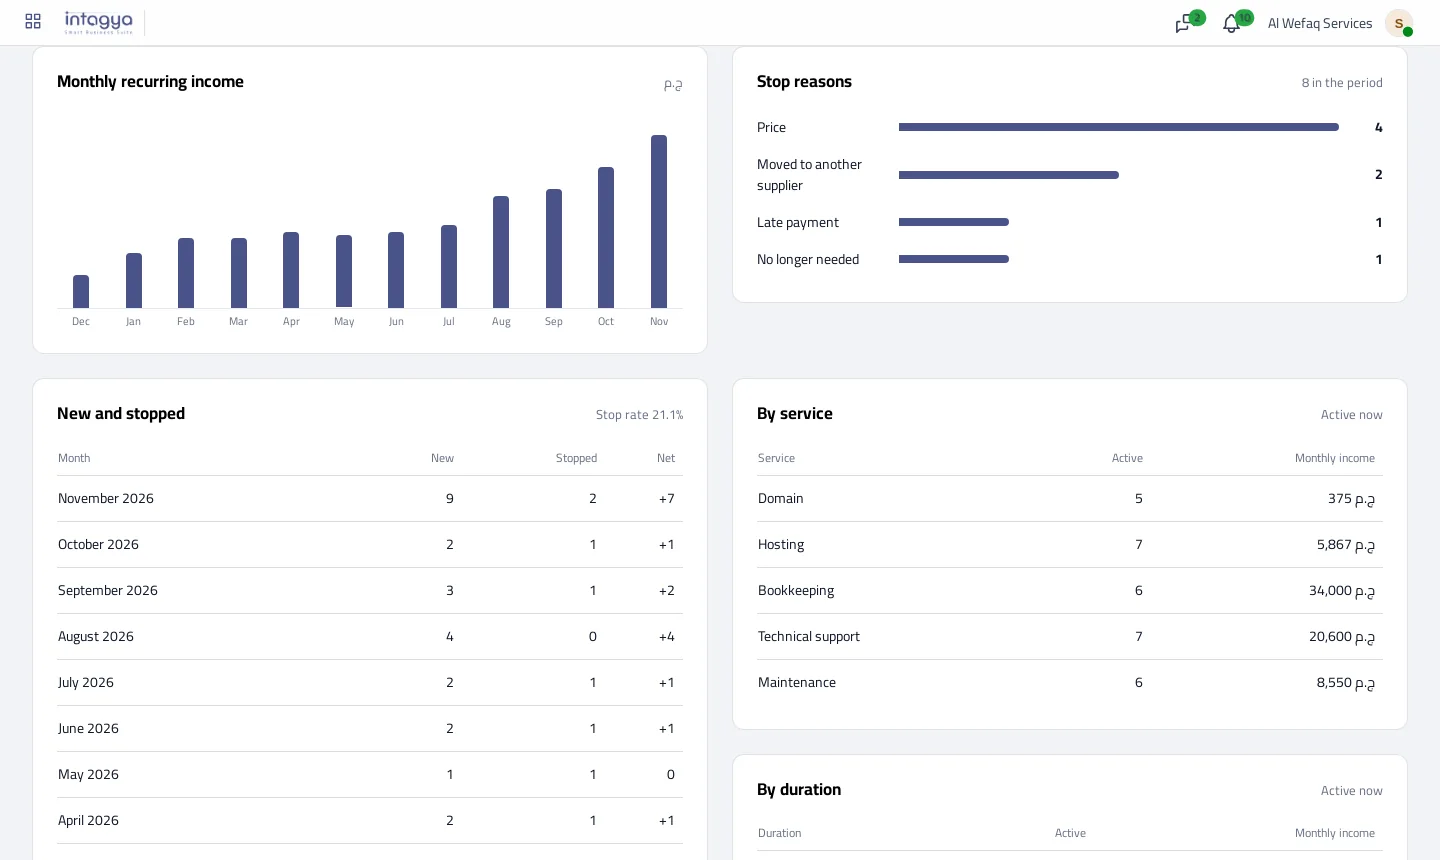
If price keeps coming up on one plan, you know where to look. If no longer needed keeps coming up, the problem may be who you sell to in the first place.
How is the stop rate worked out?
It is the number stopped in the period, divided by everything running during it. It ignores the status filter, since it always measures against all of them. Beside it, a table shows each month: new, stopped and net.
How is the figure worked out on a small example?
A made-up example with three subscriptions before tax: monthly hosting at 900, a yearly domain at 900 and quarterly bookkeeping at 17,000.
- Hosting is 900 a month.
- The domain is 75 a month.
- Bookkeeping is about 5,667 a month.
That totals about 6,642 a month. Yet a given month may issue only the hosting invoice, 900. So the figure differs from the month's invoices, and that is the point: one measures the strength of your business, the other what went out this month.
Quantity counts too, so a subscription with a quantity of three enters at three times its price.
What does this figure not tell me?
It does not tell you what reached the bank. A late subscription stays in monthly income because it is still running, so watch the late payment figure beside it.
The chart also works out past months at today's plan prices. Raise a plan price today and earlier bars rise with it. Read it for the direction of your subscriptions and their mix, and go to the invoices in Accounting for the real figures of past months.
When does a subscription show as stopped in the report?
If you stop it at the end of the paid period, it stays active until that date, then joins the stopped ones. A subscription that reaches its end date shows as ended, and counts neither in the stop rate nor the reasons, since it completed the agreed term.
Be careful with the rate on small numbers. Two stopped out of ten gives 20%, a frightening figure that says little. Look at the reason before the rate.
Review the report once a month on the same day and note the monthly income. The direction tells you more than any single month.
Start today by recording a reason for every stop, however small. In three months you will know what you did not know before.
Read the subscriptions guide step by step
FAQ
Does monthly income include tax?
No. It is worked out before tax.
Does a paused subscription count?
No. Only active and late ones count.
Can I export the report?
Yes, to Excel, with the chosen filters, in sheets for the summary, income, new and stopped, reasons, service and duration.
Who sees the reports?
Subscription managers only. The role is given from the access screen.
Is this your business?
Want to see IntagyaERP on your own workflow?
Book a demo, tell us how your business runs, and watch the system handle a real scenario from your company.
Book a demo